Vol. 3B 19-3
PERFORMANCE-MONITORING EVENTS
19.2
PERFORMANCE MONITORING EVENTS FOR 6TH GENERATION INTEL®
CORE™ PROCESSOR
6th Generation Intel
®
Core™ processors are based on the Skylake microarchitecture. They support the architec-
tural performance-monitoring events listed in Table 19-1. Fixed counters in the core PMU support the architecture
events defined in Table 19-2. Non-architectural performance-monitoring events in the processor core are listed in
Table 19-3. The events in Table 19-3 apply to processors with CPUID signature of DisplayFamily_DisplayModel
encoding with the following values: 06_4EH and 06_5EH. Table 19-8 lists performance events supporting Intel TSX
(see Section 18.11.5) and the events are applicable to processors based on Skylake microarchitecture. Where
Skylake microarchitecture implements TSX-related event semantics that differ from Table 19-8, they are listed in
Table 19-4.
The comment column in Table 19-3 uses abbreviated letters to indicate additional conditions applicable to the
Event Mask Mnemonic. For event umasks listed in Table 19-3 that do not show “AnyT”, users should refrain from
programming “AnyThread =1” in IA32_PERF_EVTSELx.
IA32_PERF_FIXED_CTR2
30BH
CPU_CLK_UNHALTED.REF
This event counts the number of reference cycles when the
core is not in a halt state and not in a TM stop-clock state.
The core enters the halt state when it is running the HLT
instruction or the MWAIT instruction.
This event is not affected by core frequency changes (e.g.,
P states) but counts at the same frequency as the time
stamp counter. This event can approximate elapsed time
while the core was not in a halt state and not in a TM stop-
clock state.
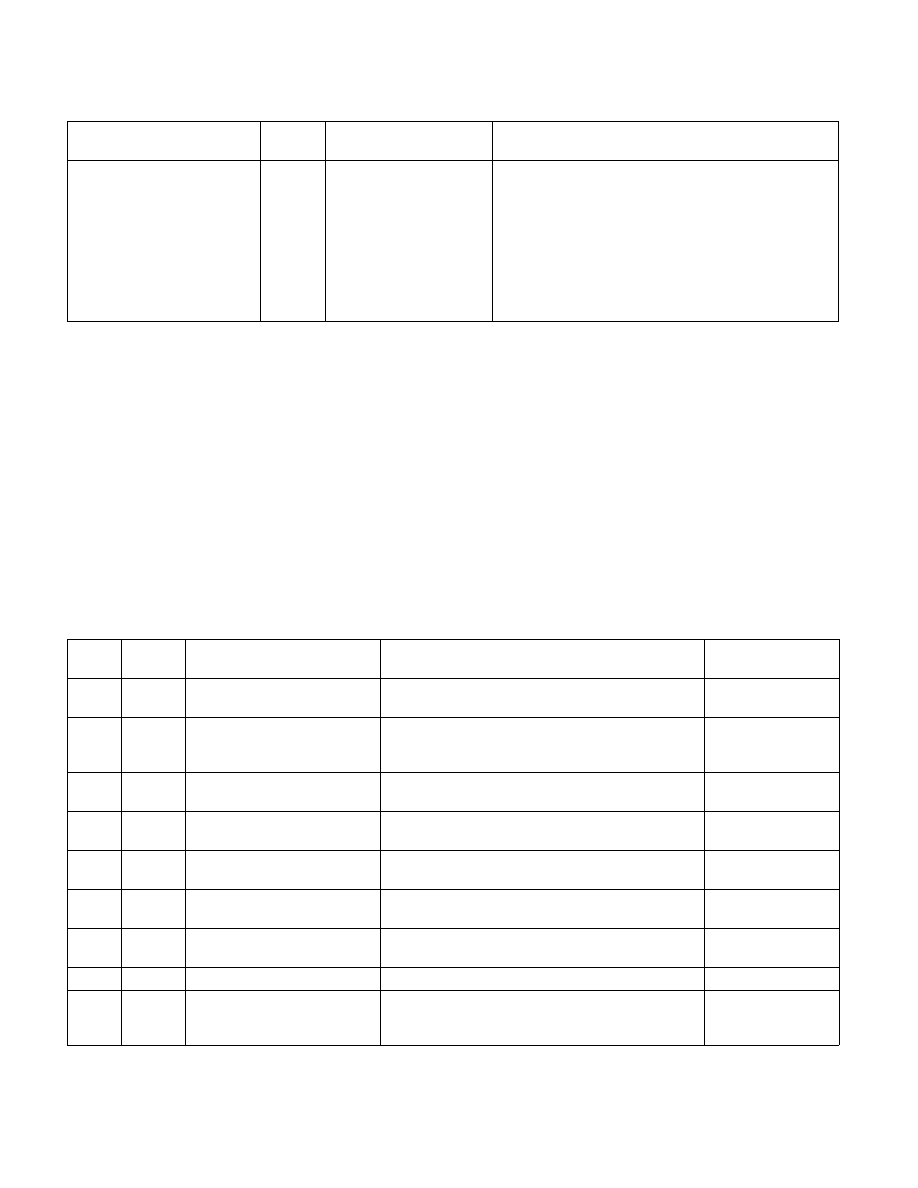
Table 19-3. Non-Architectural Performance Events of the Processor Core Supported by Skylake Microarchitecture
Event
Num.
Umask
Value
Event Mask Mnemonic
Description
Comment
03H
02H
LD_BLOCKS.STORE_FORWARD
Loads blocked by overlapping with store buffer that
cannot be forwarded.
03H
08H
LD_BLOCKS.NO_SR
The number of times that split load operations are
temporarily blocked because all resources for handling
the split accesses are in use.
07H
01H
LD_BLOCKS_PARTIAL.ADDRESS
_ALIAS
False dependencies in MOB due to partial compare on
address.
08H
01H
DTLB_LOAD_MISSES.MISS_CAUS
ES_A_WALK
Load misses in all TLB levels that cause a page walk of
any page size.
08H
0EH
DTLB_LOAD_MISSES.WALK_COM
PLETED
Load misses in all TLB levels causes a page walk that
completes. (All page sizes.)
08H
10H
DTLB_LOAD_MISSES.WALK_PEN
DING
Counts 1 per cycle for each PMH that is busy with a
page walk for a load.
08H
10H
DTLB_LOAD_MISSES.WALK_ACT
IVE
Cycles when at least one PMH is busy with a walk for a
load.
CMSK1
08H
20H
DTLB_LOAD_MISSES.STLB_HIT
Loads that miss the DTLB but hit STLB.
0DH
01H
INT_MISC.RECOVERY_CYCLES
Core cycles the allocator was stalled due to recovery
from earlier machine clear event for this thread (for
example, misprediction or memory order conflict).
Table 19-2. Fixed-Function Performance Counter and Pre-defined Performance Events (Contd.)
Fixed-Function Performance
Counter
Address Event Mask Mnemonic
Description