Vol. 3B 17-37
DEBUG, BRANCH PROFILE, TSC, AND RESOURCE MONITORING FEATURES
17.13 LAST BRANCH, INTERRUPT, AND EXCEPTION
RECORDING (PENTIUM M PROCESSORS)
Like the Pentium 4 and Intel Xeon processor family, Pentium M processors provide last branch interrupt and excep-
tion recording. The capability operates almost identically to that found in Pentium 4 and Intel Xeon processors.
There are differences in the shape of the stack and in some MSR names and locations. Note the following:
•
MSR_DEBUGCTLB MSR — Enables debug trace interrupt, debug trace store, trace messages enable,
performance monitoring breakpoint flags, single stepping on branches, and last branch. For Pentium M
processors, this MSR is located at register address 01D9H. See Figure 17-16 and the entries below for a
description of the flags.
— LBR (last branch/interrupt/exception) flag (bit 0) — When set, the processor records a running trace
of the most recent branches, interrupts, and/or exceptions taken by the processor (prior to a debug
exception being generated) in the last branch record (LBR) stack. For more information, see the “Last
Branch Record (LBR) Stack” bullet below.
— BTF (single-step on branches) flag (bit 1) — When set, the processor treats the TF flag in the EFLAGS
register as a “single-step on branches” flag rather than a “single-step on instructions” flag. This mechanism
allows single-stepping the processor on taken branches. See Section 17.4.3, “Single-Stepping on
Branches,” for more information about the BTF flag.
— PBi (performance monitoring/breakpoint pins) flags (bits 5-2) — When these flags are set, the
performance monitoring/breakpoint pins on the processor (BP0#, BP1#, BP2#, and BP3#) report
breakpoint matches in the corresponding breakpoint-address registers (DR0 through DR3). The processor
asserts then deasserts the corresponding BPi# pin when a breakpoint match occurs. When a PBi flag is
clear, the performance monitoring/breakpoint pins report performance events. Processor execution is not
affected by reporting performance events.
— TR (trace message enable) flag (bit 6) — When set, branch trace messages are enabled. When the
processor detects a taken branch, interrupt, or exception, it sends the branch record out on the system bus
as a branch trace message (BTM). See Section 17.4.4, “Branch Trace Messages,” for more information
about the TR flag.
— BTS (branch trace store) flag (bit 7) — When set, enables the BTS facilities to log BTMs to a memory-
resident BTS buffer that is part of the DS save area. See Section 17.4.9, “BTS and DS Save Area.”
— BTINT (branch trace interrupt) flag (bits 8) — When set, the BTS facilities generate an interrupt when
the BTS buffer is full. When clear, BTMs are logged to the BTS buffer in a circular fashion. See Section 17.4.5,
“Branch Trace Store (BTS),” for a description of this mechanism.
•
Debug store (DS) feature flag (bit 21), returned by the CPUID instruction — Indicates that the
processor provides the debug store (DS) mechanism, which allows BTMs to be stored in a memory-resident
BTS buffer. See Section 17.4.5, “Branch Trace Store (BTS).”
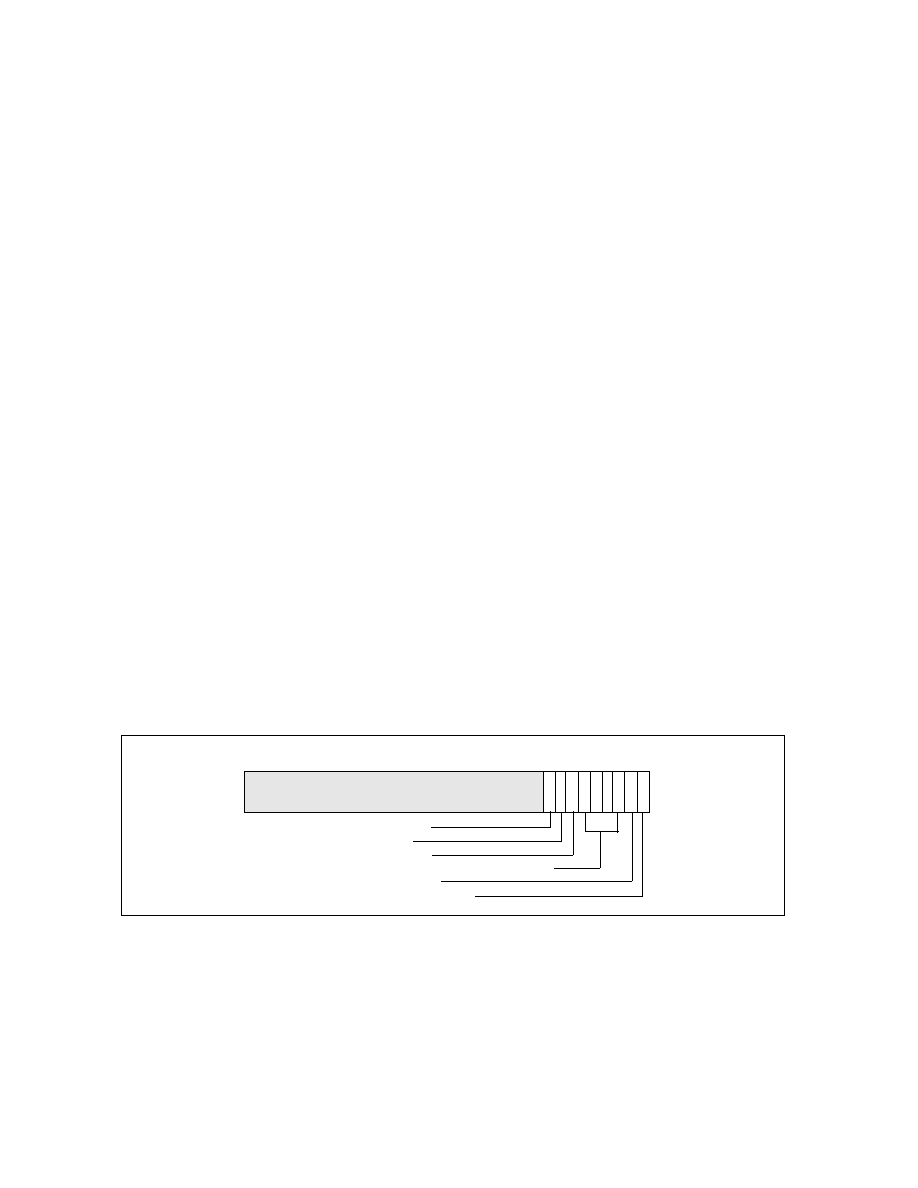
Figure 17-16. MSR_DEBUGCTLB MSR for Pentium M Processors
31
TR — Trace messages enable
BTINT — Branch trace interrupt
BTF — Single-step on branches
LBR — Last branch/interrupt/exception
Reserved
8 7 6 5 4 3 2 1 0
BTS — Branch trace store
PB3/2/1/0 — Performance monitoring breakpoint flags