Vol. 3B 19-143
PERFORMANCE-MONITORING EVENTS
19.11 PERFORMANCE MONITORING EVENTS FOR PROCESSORS BASED ON THE
GOLDMONT MICROARCHITECTURE
Next Generation Intel Atom processors based on the Goldmont microarchitecture support the architectural perfor-
mance-monitoring events listed in Table 19-1 and fixed-function performance events using a fixed counter. In addi-
tion, they also support the following non-architectural performance-monitoring events listed in Table 19-24. These
events also apply to processors with CPUID signatures of 06_5CH and 06_5FH.
Performance monitoring event descriptions may refer to terminology described in Section B.2, “Intel® Xeon®
processor 5500 Series,” in Appendix B of the Intel® 64 and IA-32 Architectures Optimization Reference Manual.
In Goldmont microarchitecture, performance monitoring events that support Processor Event Based Sampling
(PEBS) and PEBS records that contain processor state information that are associated with at-retirement tagging
are marked by “Precise Event”.
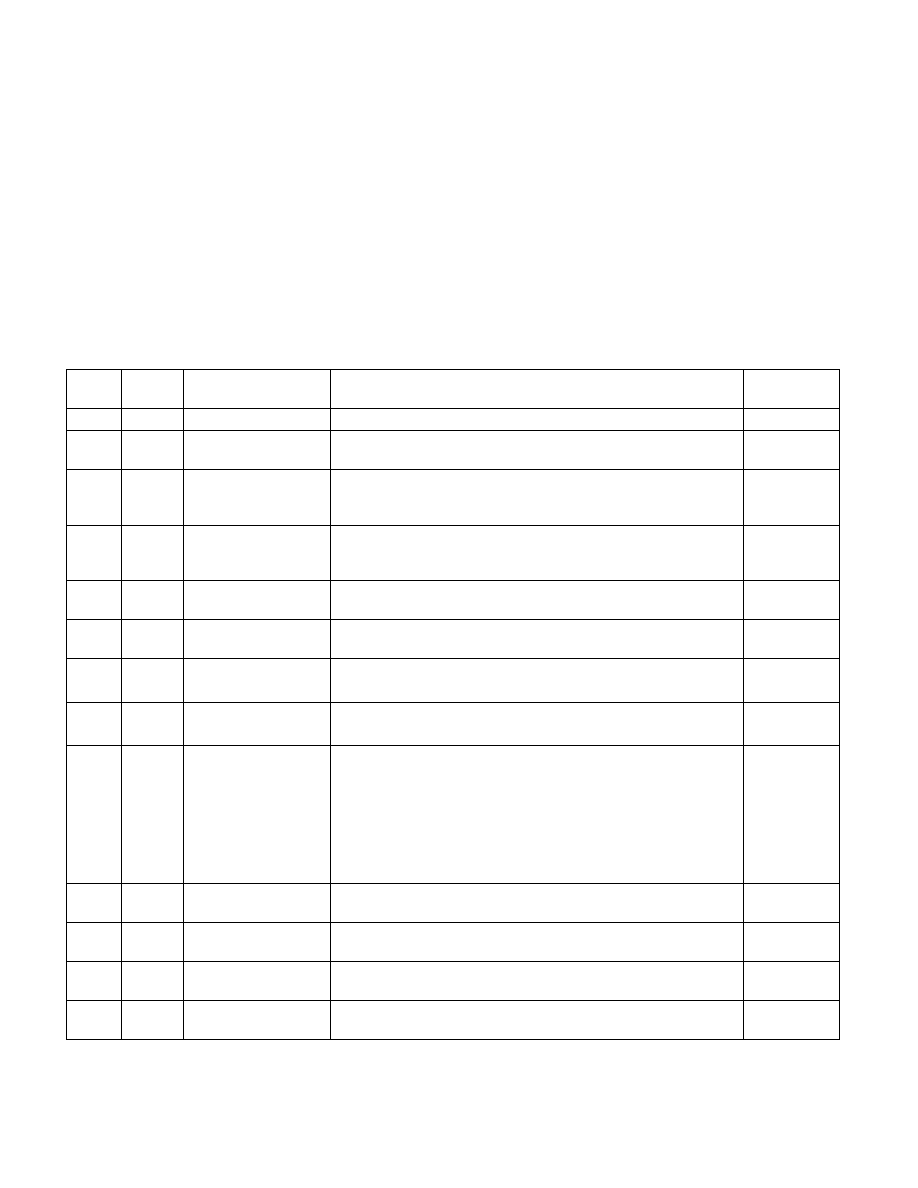
Table 19-24. Non-Architectural Performance Events for the Goldmont Microarchitecture
Event
Num.
Umask
Value
Event Name
Description
Comment
03H
10H
LD_BLOCKS.ALL_BLOCK Counts anytime a load that retires is blocked for any reason.
Precise Event
03H
08H
LD_BLOCKS.UTLB_MISS Counts loads blocked because they are unable to find their physical
address in the micro TLB (UTLB).
Precise Event
03H
02H
LD_BLOCKS.STORE_FO
RWARD
Counts a load blocked from using a store forward because of an
address/size mismatch; only one of the loads blocked from each store
will be counted.
Precise Event
03H
01H
LD_BLOCKS.DATA_UNK
NOWN
Counts a load blocked from using a store forward, but did not occur
because the store data was not available at the right time. The forward
might occur subsequently when the data is available.
Precise Event
03H
04H
LD_BLOCKS.4K_ALIAS
Counts loads that block because their address modulo 4K matches a
pending store.
Precise Event
05H
01H
PAGE_WALKS.D_SIDE_C
YCLES
Counts every core cycle when a Data-side (walks due to data operation)
page walk is in progress.
05H
02H
PAGE_WALKS.I_SIDE_CY
CLES
Counts every core cycle when an Instruction-side (walks due to an
instruction fetch) page walk is in progress.
05H
03H
PAGE_WALKS.CYCLES
Counts every core cycle a page-walk is in progress due to either a data
memory operation, or an instruction fetch.
0EH
00H
UOPS_ISSUED.ANY
Counts uops issued by the front end and allocated into the back end of
the machine. This event counts uops that retire as well as uops that
were speculatively executed but didn't retire. The sort of speculative
uops that might be counted includes, but is not limited to those uops
issued in the shadow of a mispredicted branch, those uops that are
inserted during an assist (such as for a denormal floating-point result),
and (previously allocated) uops that might be canceled during a
machine clear.
13H
02H
MISALIGN_MEM_REF.LO
AD_PAGE_SPLIT
Counts when a memory load of a uop that spans a page boundary (a
split) is retired.
Precise Event
13H
04H
MISALIGN_MEM_REF.ST
ORE_PAGE_SPLIT
Counts when a memory store of a uop that spans a page boundary (a
split) is retired.
Precise Event
2EH
4FH
LONGEST_LAT_CACHE.
REFERENCE
Counts memory requests originating from the core that reference a
cache line in the L2 cache.
2EH
41H
LONGEST_LAT_CACHE.
MISS
Counts memory requests originating from the core that miss in the L2
cache.